

The Great Way Is Simple: PostgreSQL Ops Subtraction and Governance Philosophy for Large-Scale Complex Business
A HOW 2026 talk on taming the exponential complexity of large-scale PostgreSQL operations — from alert storms and configuration drift to the ops-subtraction philosophy, the five knives of governance, and AI-driven monitoring and prediction.
Yan Shuli
PostgreSQL ACE
This article is compiled from the HOW 2026 presentation by Yan Shuli, deputy editor-in-chief of《快速掌握 PostgreSQL 版本新特性》, technical consultant at 云和恩墨 (Enmotech), and PG ACE.
Introduction
When database instances grow from a few sets to hundreds or even thousands, and node counts grow from several to dozens or hundreds, the complexity of operations does not increase linearly — it rises exponentially. In large-scale PostgreSQL operations practice, we face many shared anxieties: the alert storm of monitoring, the maze of parameter configuration, the avalanche of object scale, abrupt execution-plan changes, lagging reactive scaling, the black hole of backup and recovery… These problems are not merely technical challenges; they are a deep reflection on operations philosophy and governance philosophy.
Today, I will share our thinking and explorations in large-scale PG operations practice from four dimensions: the complexity trap of PG operations, the concept of ops subtraction, the five knives of governance, and monitoring prediction and AI intelligence.
1. The Complexity Trap of PG Operations: From Alert Storms to Plugin Jungles
As business volume grows, the original model of purely manual operations becomes hard to sustain. The following are seven traps commonly seen in production environments:
1.1 Alert Storm of Monitoring: Signal-to-Noise Imbalance
Hundreds of metrics pile up, and hundreds of alerts flood the screen. Operators are woken up by alerts in the middle of the night only to find they are false alarms. Over time, this breeds alert fatigue, and real failures end up drowned in the noise. The core problem is: more alerts ≠ more effectiveness, complete metrics ≠ controllability.
1.2 Parameter-Configuration Maze: Loss of Environment Consistency
PostgreSQL has hundreds of GUC parameters, and different DBAs have different tuning habits. The same SQL behaves differently across databases; configuration drift makes failures unreproducible, and when troubleshooting hidden risks in batches it is hard to quickly locate the environment at fault.
1.3 Object-Scale Avalanche: Ops Boundaries Out of Control
Instances, tables, indexes, and partitions keep piling up. With hundreds of millions of rows of historical data accumulated, the complexity of database management rises exponentially. If the initial architecture design leaves no headroom for expansion, systemic bottlenecks will easily emerge in the later stages.
1.4 Execution-Plan Mutations: Frequent Performance Jitter
Execution plans print for pages on end, and SQL that ran normally yesterday suddenly becomes slow today. Outdated statistics, blocking long transactions, lock contention, and other problems compound each other, making the performance-troubleshooting chain complex and the root cause hard to pin down.
1.5 Lagging Reactive Scaling: Missing Capacity Planning
Business growth is unknown, and disk water levels are hard to predict. It is always only after a problem has occurred (such as a full disk) that people "slap their thighs" and rush to deal with it — there is no proactive planning capability based on trends.
1.6 Backup-Recovery Black Hole: A Line of Defense in Name Only
Backup jobs run every day, but recovery drills are never performed. A log showing "Success" does not mean the files are intact, and silent errors are hard to detect. When a real failure occurs, no one dares to vouch for the availability of the backups.
1.7 Plugin-Dependency Jungle: Upgrades Beset by Difficulties
Official extensions conflict with in-house extensions over versions, and the upgrade order is chaotic. The slightest misstep can trigger "dependency hell" and disrupt business.
Special Challenges Under Distributed Architectures
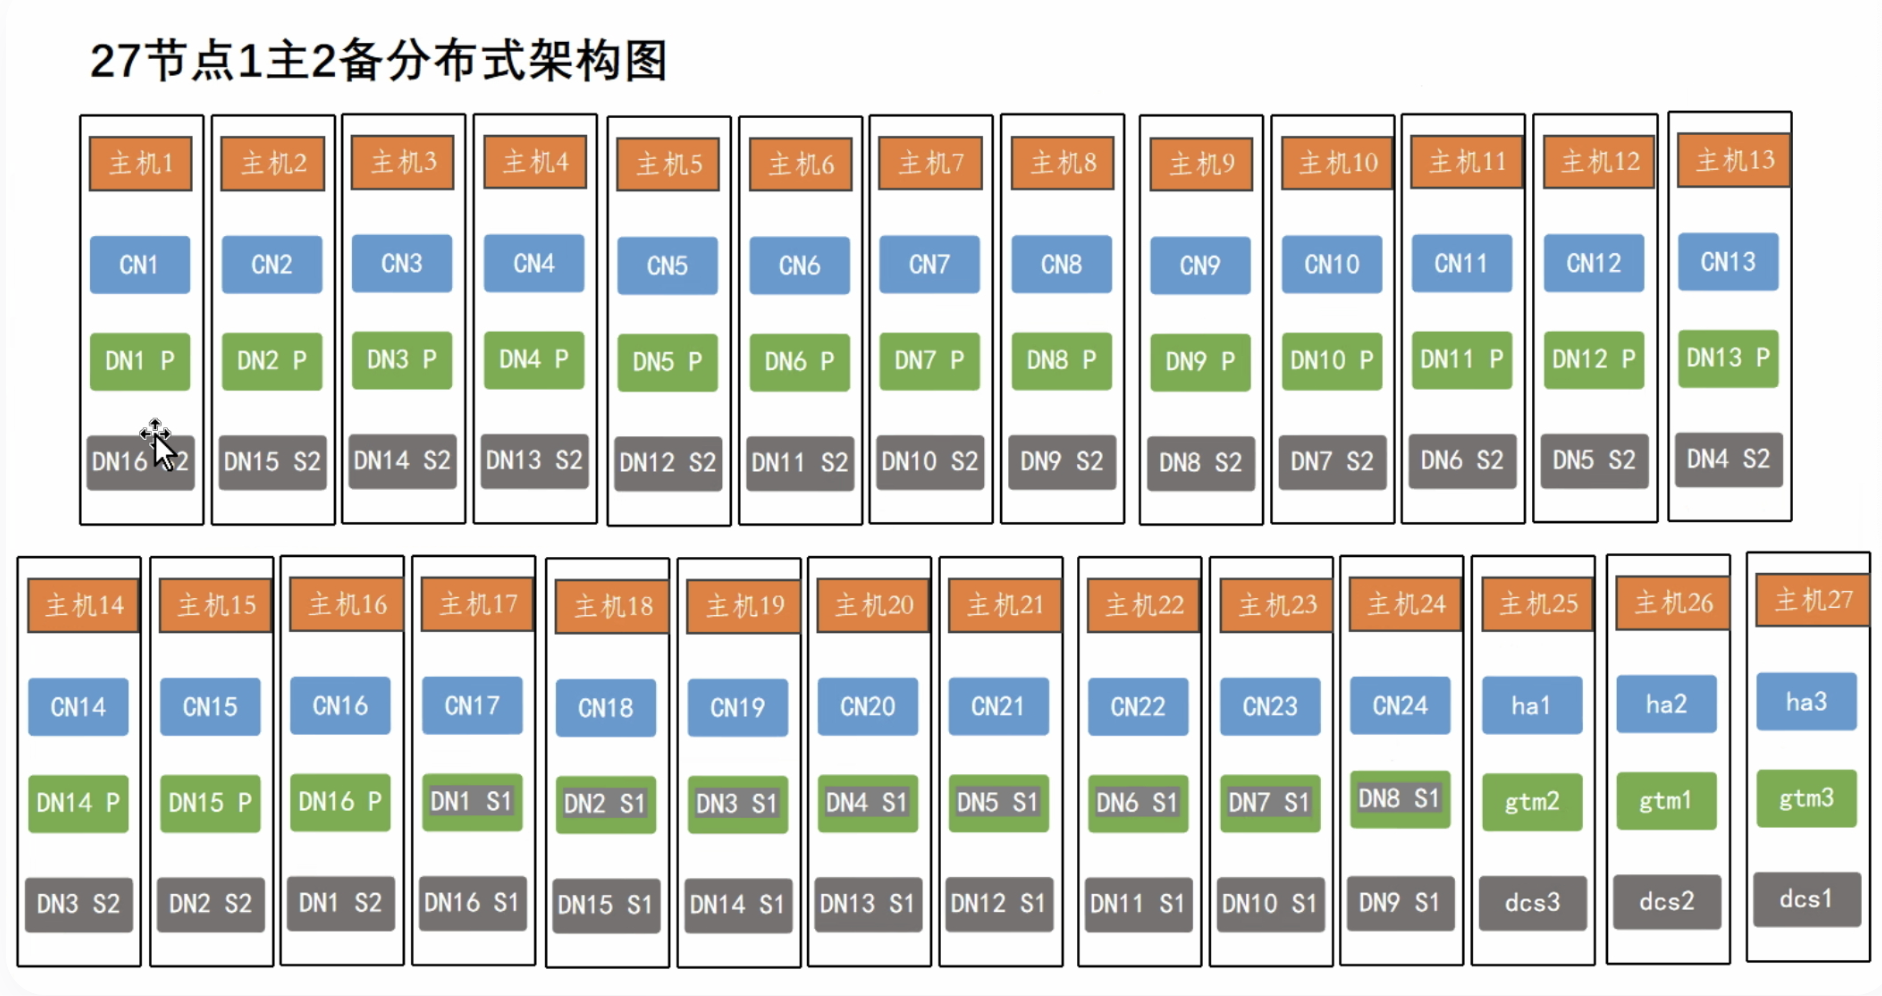
In a distributed environment, a single business can easily involve dozens or even hundreds of nodes, and components are often co-deployed — a single server may simultaneously run components of different roles (such as data nodes, coordinator nodes, monitoring nodes, etc.), with uneven resource loads and inconsistent node specifications. This complex topology further amplifies the difficulty of monitoring, resource management, and fault localization.
The Core Understanding of the Fault-Propagation Chain
Every technical problem ends in failure, and every system failure ends in business impact. Any technical anomaly will eventually propagate to the business layer, ultimately damaging the user experience and threatening business continuity. If DBAs remain in a passive firefighting state for a long time, service stability can never be fundamentally guaranteed. The ideal model should be: DBAs get involved at the very earliest stage of business design, conducting risk assessment and hidden-hazard avoidance at the source — database design, table-structure logic, and so on — so that problems are eliminated before they ever go live.
2. In-Depth Retrospective of Typical Fault Cases
Case 1: A Production Disaster Caused by SQL Syntax Misuse
Event recap
During a business release, one problematic statement slipped into a batch of SQL. It was not caught by the SQL review tool and was not fully verified in the test environment, causing data in a core table with hundreds of millions of rows in production to be wrongly overwritten.
The incorrect form:
UPDATE table SET a='xxx' AND b='xxx' WHERE a='xxx';
Here the AND logical operator is misused: the database parses a='xxx' AND b='xxx' as a whole into a boolean expression, so column a is assigned a boolean value (0 or 1) instead of the intended string.
The correct form:
UPDATE table SET a='xxx', b='xxx' WHERE a='xxx';
Recovery approach
A PITR point-in-time recovery was performed from backups: the data was restored to its pre-mistake state in a separate environment, and the affected data was then exported and restored to production, minimizing data loss to the greatest extent.
Lessons learned
- Backup: the last line of defense for core data — recoverability must be guaranteed
- Review: the first gate before SQL goes live — automated rule-based validation is a must
- Verification: test environments require full-coverage drills to expose potential problems early
- Standards: establish standardized change processes and strengthen automated SQL review
Case 2: The Long-Transaction Hazard Behind Table Bloat
Symptoms
Dead tuples in the table could not be cleaned up, causing the table size to balloon; manually running VACUUM had no effect. The corresponding SQL's execution time doubled, eventually triggering 504 timeouts on the business interface.
Root cause
There were uncommitted long transactions in the database holding old snapshots, which prevented the MVCC mechanism from reclaiming old tuple versions, so the table bloat could not be relieved.
Solution
Locate and terminate or commit the blocking long transactions. After the transactions end, VACUUM can reclaim space normally and SQL performance returns to normal.
Mindset shift
Table bloat is only a "symptom", not the "root cause". When troubleshooting, one needs to build link-chain thinking: symptom → intermediate metric (long transactions) → root cause. The monitoring system needs to extend from "single-point metric monitoring" to "business causal-chain monitoring" so that problems can be prevented before they occur.
Alert-tuning suggestions
A single metric is prone to false alarms. Combined-condition alert rules can be designed instead — for example, trigger a critical alert only when table bloat ratio > 30% AND longest transaction > 30 min are both satisfied.
3. What Is "Ops Subtraction"?
"Ops subtraction" is not about passively cutting work; it is about doing fewer — but more correct — things. Its core idea can be summarized as:
Shift from reactive firefighting to proactive design; evolve from manual operations to closed-loop verification.

Specifically, it includes three evolutionary stages:
Stage 1: Standardization
Unify environment configurations and operation procedures, eliminate environmental differences, and establish a single standard path. Put enough effort into environment planning and the early stages before business goes live, and strangle potential hazards at the source.
- Hardware configuration: unify on SSD disk types, divided into three tiers of specifications — large/medium/small — with capacity reserved for 3–6 months
- Operating system: baseline kernel parameters so that all machines stay consistent, and unify time zones and NTP synchronization
- Database: unify on a single major version, preset parameter templates by workload scenario (OLTP/OLAP), and standardize directories and ports
Stage 2: Automation
Replace repetitive manual operations with code and scripts to achieve one-click operations on a platform, freeing people from tedious day-to-day maintenance. Note, however, that automation should follow fixed processes rather than let the system make fully autonomous decisions.
Stage 3: Intelligentization
Based on AI, continuously analyze workload characteristics and proactively assist decision optimization. In the database domain, however, a cautious attitude must be maintained — the data in databases is of vital importance, and even if AI has a 99% success rate, the loss that the 1% failure could cause is hard to bear. The correct positioning is: use AI as a tool, but keep the final decision-making authority in human hands.
4. The Five Knives of Governance
The First Knife: Parameter Baselines and Index Governance
Standardized management with scenario-based adaptation
Based on host hardware resources (CPU/memory) at fixed ratios, parameter templates are preset for three core workload scenarios — OLTP, OLAP, and mixed load. When a new cluster is initialized, the matching template is automatically applied, delivering the standard of "optimal from the moment it goes live".
Key note: A baseline is the benchmark for management — do not ignore business differences for the sake of "uniformity". When necessary, make customized fine-tuning against the actual scenario, and mark it clearly.
An intelligent index scoring system
Automatically scan all indexes and precisely identify four types of problematic indexes:
- ⚠️ Indexes unused for more than 90 days
- 🔄 Duplicate indexes
- 📉 Indexes with extremely low selectivity
- 📊 Indexes with high write/storage cost
Combined with table structures and query scenarios, each index is scored across multiple health dimensions (hit rate / write amplification / space usage), and problematic indexes are automatically flagged with drop/merge/rebuild recommendations. A unified dashboard displays the governance status, completing the shift from "reactive firefighting" to "proactive governance".
The Second Knife: Refining Monitoring and Alerts
From "watching countless dashboards" to "watching core business KPIs"
Focus on the four golden metrics and strip away 90% of redundant metrics:
- Latency
- Error
- Throughput
- Saturation
Alert governance and noise removal
Goal: make "an alert mean a risk". Say a firm "no" to noise that is duplicated, jittery, or has no fix action:
- Consolidate duplicate alerts
- Suppress transient jitter
- Remove invalid alerts without a clear Action
Dynamic threshold tuning
Adjust thresholds dynamically based on historical baseline data, rejecting one-size-fits-all fixed thresholds. For example, the connection-count threshold was adjusted from a fixed 80% to 85% based on business characteristics, effectively reducing unnecessary frequent alerts.
Tiered collection strategy
Distinguish between two modes of monitoring:
- Continuous collection: real-time awareness of resource status (e.g., CPU, memory, connection count)
- Periodic checks: proactive discovery of hidden hazards (e.g., backup status, table-bloat trends)
Periodic check items are organized separately so that high-frequency collection does not cause unnecessary consumption of host resources.
The Third Knife: Change Review and SQL Review
An automated change closed loop
Pain point: adding indexes or changing parameters requires DBAs to execute them manually in the middle of the night; manual operations have a high error rate, and change risk is uncontrollable.
Solution: business raises a ticket → SQL is automatically generated → syntax validation → DBA review → automatic execution. The whole process forms a closed loop with zero manual commands.
A hard line of defense with SQL review rules
Challenge: a single "demon query" (such as a full-table scan) can bring down the production database.
Defense: intercept full-table scans, Cartesian products, and oversized result sets before they go live. Based on deep parsing of the syntax tree, all kinds of performance-hazard SQL are precisely identified and intercepted; automatic interception plus manual re-check ensures that problematic SQL can never enter production.
The Fourth Knife: Pre-Launch Performance Testing and Risk Assessment
Before a business goes live, simulate real high-concurrency scenarios to quantitatively estimate the execution time of SQL on core paths. This step can identify system performance bottlenecks in advance and eliminate potential problems before they go live.
Core principle: thorough load testing + risk assessment = smooth launch · uninterrupted business operation
The Fifth Knife: Refusing "Schrödinger's Backup"
Pain points and misconceptions:
- A log showing "Success" ≠ intact files — silent errors are hard to detect
- Backups have run for half a year without ever being verified, and the unavailability is only discovered when a disaster strikes
- Recovery time (RTO) is a promised value that easily exceeds the target as data volume grows
Core belief: Only a backup that has been successfully recovered truly exists.
Key recovery metrics visualized (8 core items):
- Full-backup transfer time
- WAL log rate
- Data decompression time
- Full-restore execution
- Log replay time
- PITR point accuracy
- System startup validation
- Total RTO time
It is recommended to run backup-and-recovery verification automatically on a regular basis, ensuring that backups not only "execute successfully" but can also "recover successfully".
5. Monitoring Prediction and AI Intelligence
Core Building Blocks of an Intelligent Operations Architecture
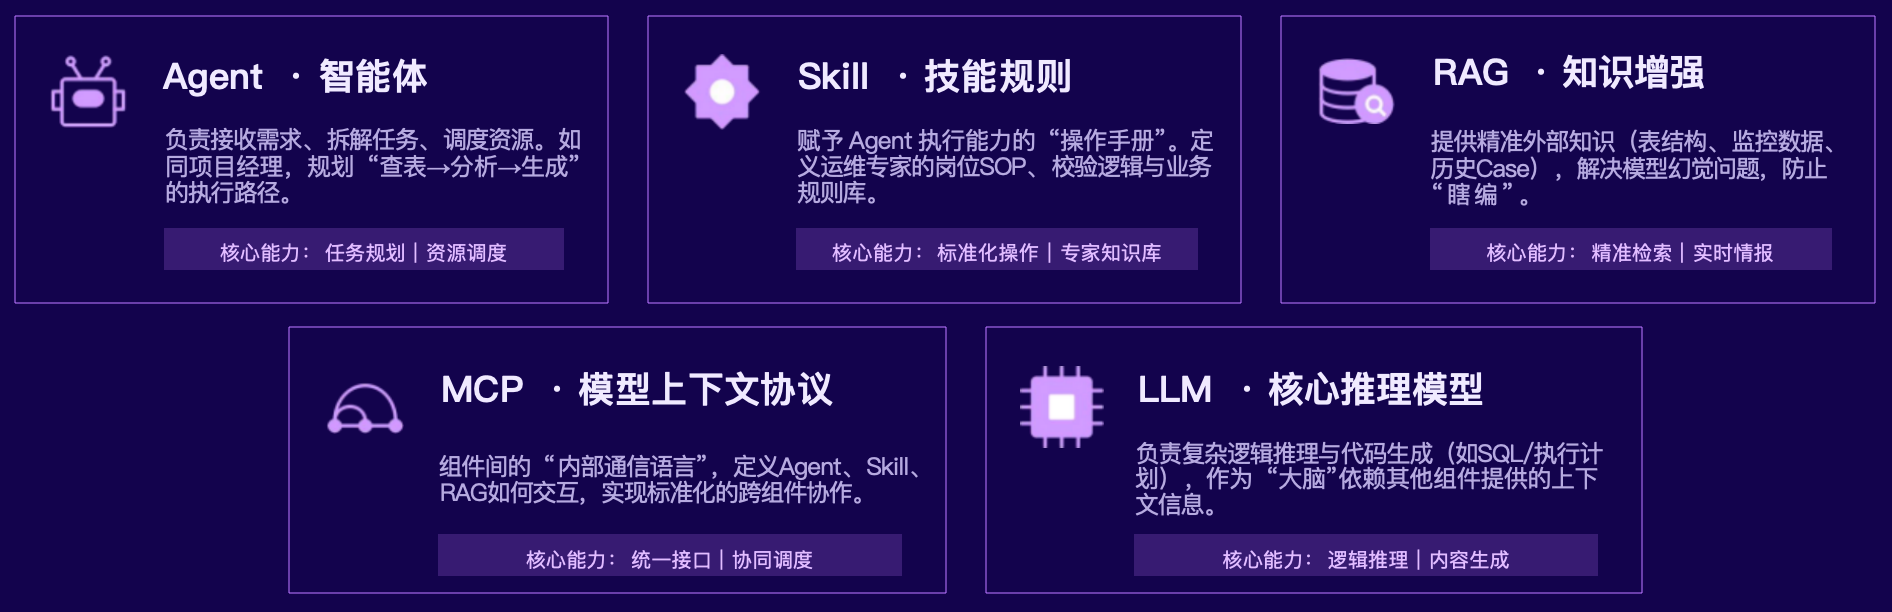
Built on large-model technology, an intelligent operations system relies on five core components working together:
| Component | Role | Core capability |
|---|---|---|
| LLM | Core reasoning model | Handles complex logical reasoning and code generation (e.g., SQL/execution-plan analysis) |
| Agent | Intelligent agent | Receives requirements, decomposes tasks, and schedules resources, like a project manager planning the execution path |
| RAG | Knowledge augmentation | Provides precise external knowledge (table structures, monitoring data, historical cases) to address model hallucination |
| Skill | Skill rules | Defines the position SOPs, validation logic, and business rule library of operations experts |
| MCP | Model Context Protocol | Defines the interaction patterns between components for standardized cross-component collaboration |
Five Intelligent Operations Scenarios
- In-depth SQL performance tuning: parse execution plans and index recommendations to precisely locate the root cause of slow queries
- Real-time intelligent diagnosis: based on multi-dimensional monitoring metrics, answer status questions in real time and automatically identify performance bottlenecks
- Capacity trend forecasting: predict storage and load growth trends and give early warnings of capacity risks
- Deep mining of log hazards: automatically analyze massive logs to precisely identify error logs, lock contention, and configuration-parameter risk points
- Instant Q&A on professional knowledge: 7×24 intelligent Q&A empowering operations decisions
Vector Retrieval and Intelligent Correlation Analysis
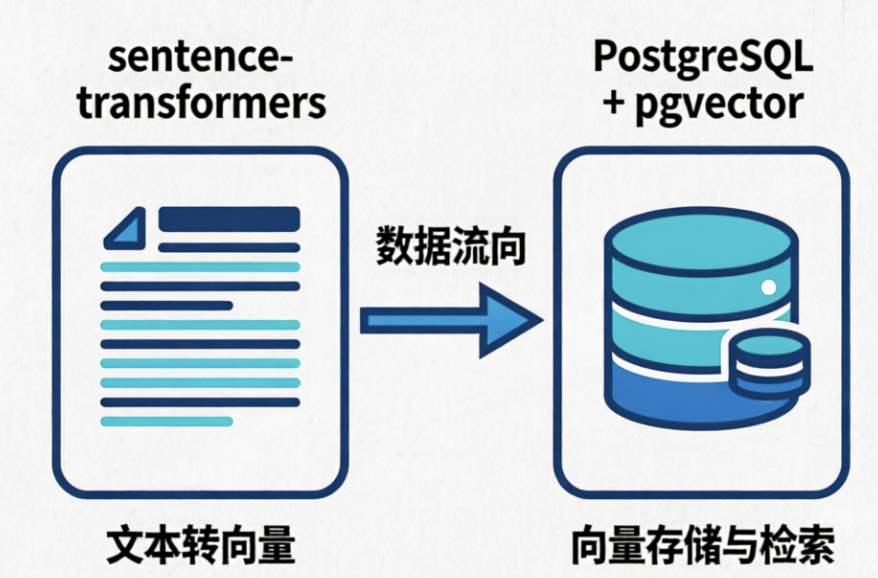
With the help of the pgvector extension of PostgreSQL, unstructured data produced by operations (logs, alerts) is converted into high-dimensional vectors and stored, breaking the limits of traditional keyword retrieval.
Implementation flow:
- Template-based cleaning: filter variable noise such as timestamps and IDs from raw logs and unify the data caliber
- Semantic vectorization: generate high-dimensional semantic vectors from the cleaned text via a pretrained model and store them in pgvector
- Intelligent alert correlation: when a new alert is generated, retrieve similar vectors within the time window in real time and automatically aggregate related alerts
Core value: upgrading from traditional "fuzzy keyword search" to "semantics-based vector similarity analysis" enables automatic correlation of alerts across systems and root-cause location within seconds, breaking down information silos.
Capacity Trend Prediction
Based on historical resource-growth-rate data, train a multi-dimensional capacity prediction model to comprehensively analyze resource usage patterns, achieving earlier warnings that are more precise than traditional thresholds.
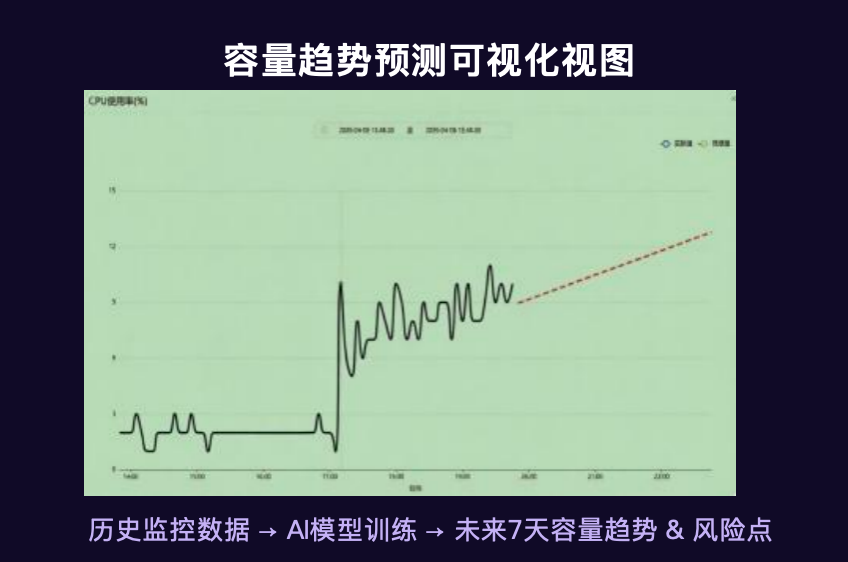
Choosing a prediction method:
- Linear regression: suitable for metrics with obvious periodicity (such as morning/evening peaks) and trends (connection count, CPU); simple to compute and highly interpretable
- Time-series forecasting (ARIMA/Holt-Winters): suitable for scenarios with complex fluctuations, no obvious periodicity, or a need for mid-to-long-term prediction
- Machine learning (LSTM): precisely captures nonlinear relationships, long-range dependencies, and multi-variable coupling, but requires large amounts of historical data and computing power
Formula for estimating the number of days of disk remaining:
T = (Disk_total × 90% - Disk_now) / R
Where:
- Disk_total = total capacity (calculated at the 90% warning line)
- Disk_now = current usage
- R = predicted average daily growth
Core Principles for Landing RAG in Practice
In the landing process of AI-assisted operations, the following constraints deserve particular attention:
- Prioritize citing the latest sources: add rules or code to the Prompt to filter by time, ensuring retrieval quality
- Graceful degradation when retrieval fails: when context is insufficient, forbid the LLM from fabricating answers — it should clearly state that "no relevant information was found in the knowledge base"
- End-to-end observability tracking: monitor "retrieval precision" and "answer accuracy" in real time, so that abnormal metrics can quickly locate the problematic stage
- Driven by structured test cases: use TestCases to drive RAG iteration, defining keywords that must be included and must be prohibited, and continuously optimize model performance
Core principle: when the system is not sure of information, let it honestly answer "I don't know", rather than force out an answer that looks plausible but is actually wrong.
Summary
The essence of large-scale PostgreSQL operations is a paradigm shift from "piling up manpower" to "systematic governance". Through standardization we establish baselines, through automation we free up people, and through intelligentization we assist decision-making — in this way we can build a highly resilient database operations system in complex business scenarios.
The five knives of governance — parameter baselines, index governance, alert refinement, change review, and backup verification — form a complete closed loop from day-to-day operations to emergency response. The introduction of AI technology injects the capabilities of proactive prediction and intelligent diagnosis into this loop, moving operations from "firefighting" to "fire prevention" and from "reactive response" to "proactive design".
The great Way is simple — easier said than done. May every reflection bring us one step closer to efficient, reliable, and carefree database operations.
Previous post
From VACUUM FULL to REPACK: The Evolution of PostgreSQL Table Rewriting
Aug 17, 2026
Next post
The Cost-Comparison Revolution: A Deep Dive into Enhanced PostgreSQL Execution Plan Intervention
Sep 7, 2026
Related Posts
Try IvorySQL
Get started with IvorySQL today. Read the docs or try our online demo.